A closer look at hate crimes against Jews in the UK
Though Muslims suffer the most religiously aggravated hate crimes as recorded in police statistics, it’s also the case that Jews are ‘overrepresented’ as victims in hate crime data, per head of population. David Miller delves into the numbers in part 3 of "Are the Jews Discriminated Against?"
-

Political lobby groups were able to define the way in which hate crime against the Jews was counted in a manner which was systematically biased. (Al Mayadeen English; Illustrated by Zeinab El-Hajj)
I showed in a previous article (Part 2 of this series) that Jews are not, in aggregate, discriminated against, but on the contrary are disproportionately privileged in British society. However, there is one area of social life where there is an apparent anomaly: hate crime. Official statistics appear to show that Jews are the victims of hate crime more than any other group in proportion to their numbers in the population. This article interrogates official statistics and asks if we can believe this data.
Hate crime, according to the Metropolitan Police is any criminal offence perceived (by either the victim or a witness) to be motivated by a person’s “race or perceived race, religion or perceived religion” or other “protected characteristics” (such as disability, gender etc). In previous commentary, I have sought to distinguish between hate crime and “discrimination” and I rely on that distinction here, though that -obviously - does not mean that hate crime is not discriminatory. The point is that hate crimes, as recorded by the police, and patterns of discrimination in employment, etc. are distinguishable, and that they are counted differently by differing regulatory or governmental bodies (hate crime by the police and the Home Office) and discrimination by a range of other governmental bodies.
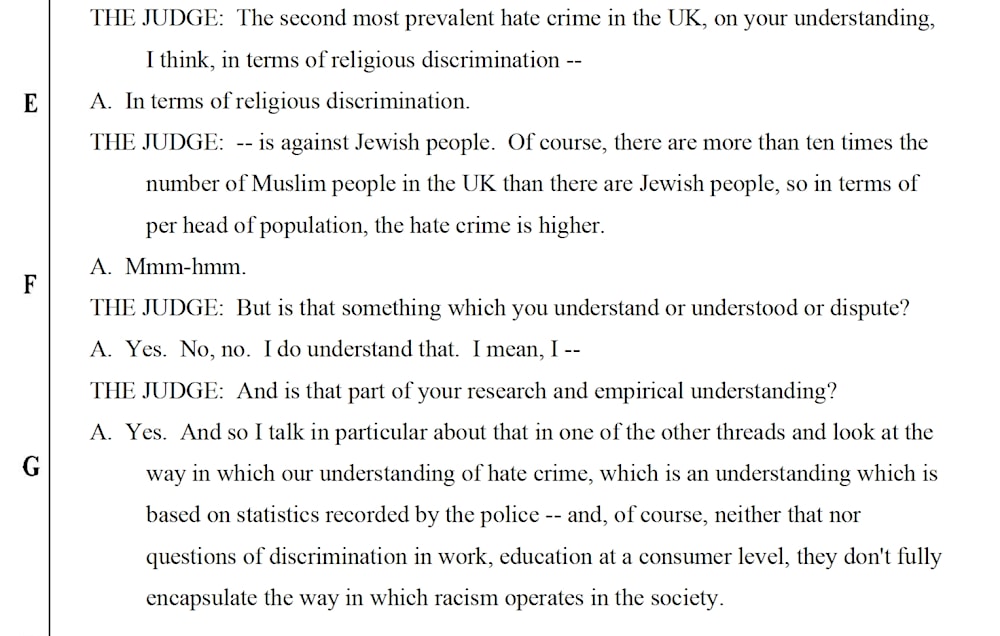
In the Tribunal judgment in my case against the University of Bristol (which I won), it is stated that I “accepted that religious crimes against Jewish people were by far the most prevalent in the UK per head of population.” It is true that I accepted that and it is also true about the data, which we shall now examine.
Below is the official data, from the Home Office. I have added two extra columns to show the proportions of each religion in the population and how the figures proportionately relate to the relative population size.
|
Perceived religion of the victim |
Number of offences |
Proportion of religious hate crimes (%) |
Percentage of population of England and Wales |
Proportion per head of population |
|
Buddhist |
18 |
0 |
0.3 |
0.8 |
|
Christian |
609 |
8 |
46.2 |
0.2 |
|
Hindu |
286 |
4 |
1.8 |
2 |
|
Jewish |
1,510 |
19 |
0.5 |
39 |
|
Muslim |
3,400 |
44 |
6.5 |
6.7 |
|
Sikh |
302 |
4 |
0.9 |
4.3 |
|
Other |
451 |
6 |
0.6 |
5.8 |
|
No religion |
166 |
2 |
37.2 |
0.6 |
|
Unknown |
1,491 |
19 |
n/a |
n/a |
|
Total number of targeted religions |
8,233 |
|
|
|
|
Total number of offences |
7,756 |
|
|
|
Sources: 1. 2022-23 data from the Home Office; 2. 2021 Census; 3. my own calculations.
The data on religion and race and hate crime
This shows that though Muslims suffer the most religiously aggravated hate crimes as recorded in police statistics (3,400 offences or 44%), it’s also the case that Jews are ‘overrepresented’ as victims in hate crime data, per head of population. Thus Jews were victims in 1,510 cases or 19% of the religiously aggravated hate crimes. But because Muslims are 6.5% of the population and Jews only 0.5% (in the 2021 Census for England and Wales) Muslims are 6 times more likely per head of population to be victims and Jews a staggering 39 times as likely per head of population. By contrast, Christians are less than proportionately affected at only 0.2 of the average per head.
However, that is not all there is to say about the matter. First of all, one can see that the discussion in the Tribunal judgment cited above was not about racist hate crime in general, which I had discussed in my posts on X, but was “religious crime” alone. Here is the passage from the transcript of the Tribunal where this was discussed. A. refers to answers given by me.
-

Transcript of the Tribunal, 20 October 2023, p. 54
The figures in the table above show that there were some 7,756 religiously motivated crimes in England and Wales in 2022/3. I was asked to agree in relation to that data that crimes against Jewish people were “by far” the most prevalent per head of population. And they are.
But when we consider the data on hate crimes in relation to “race”, we can see that the 7,756 religiously aggravated crimes are augmented by some 101,906 “racially aggravated” hate crimes. So, of a total of 109,662, racially and/or religiously motivated hate crimes, the religiously aggravated constitute some 7%. To put that in perspective Jews face some 1.3% of all racially or religiously aggravated hate crimes, and Muslims some 3.1%. So this brings the likelihood of Jews being victims down from 39 times more likely than a putative average person, to 2.75 times more likely per head of population and puts Muslims at 0.48. So, according to this calculation, Muslims are less likely than an average person to be attacked by about 50%. In descending order Sikhs (0.27), Hindus (0.26), Buddhists (0.05) and Christians (0.01) are all less likely than Muslims to be victims.
This still leaves us with Jews being more likely victims per head of population, but I think it is fair to say that they are not “by far” as was stated in the Tribunal judgment. At any rate, it is significantly less far than the figures agreed in court (39 times vs 2.75 times). It would appear, though, to be a significant social fact that while Jews on average may be relatively privileged economically, it is still the case that they are disproportionately victims of religious hate crime and indeed - though to a lesser extent - hate crime in general. But is it actually the case?
Given what we know about the propensity for Muslims to be both discriminated against - and to be the most disadvantaged religious group in the country by a long way (economically), as well as the victims of hate crime, it looks counterintuitive to find that they are less likely than average to be victims. But, of course, there must be some dubiety about whether hate crimes against Muslims (who are mostly not white) are recorded as such, or as crimes against the categories used in collecting the racially aggravated data: “Asian”, “Middle Eastern” or possibly “Chinese, Japanese or South East Asian”. Because the data categories in the Census do not map perfectly to the categories used in Hate crime statistics, we can only report that the percentages of overall religiously and racially motivated crime are as follows:
|
Identified racial category |
Number of offences |
Proportion of racially/religiously aggravated hate crimes (%) |
Percentage of population of England and Wales |
Proportion per head of population |
|
White |
13,064 |
11.9 |
81.7 |
0.1 |
|
Black |
11,274 |
10.3 |
4 |
2.6 |
|
Asian (including Chinese and other Asian) |
12,859 |
11.7 |
9.3 |
1.3 |
|
‘Middle Eastern’ (a category that maps roughly on to the “other “ category in the Census which include “Arabs”) |
1,510 |
19 |
0.5 |
0.78 |
|
All non-white |
38.707 |
35.3 |
13.8 |
1.7 |
|
All religiously motivated offences against non-Christians/Jews |
4,439 |
4 |
10.1 |
|
|
Combined |
43,146 |
39.3 |
13.8 |
2.85 |
Sources: 1. 2022-23 data from the Home Office; 2. 2021 Census; 3. my own calculations.
Similar points apply to both Sikhs and Hindus, and possibly Buddhists - of whom around 68% are not white. In addition, there are reports that Muslims may under-report hate crime, for example in this report from Peterborough and this one, from Bristol. This leaves aside the question of whether the police - due to ignorance or Islamophobia - are less likely to notice or record Islamophobia. We explore police actions on this question in a future article.
Overall, we can compare the figure for “people of colour” (Black, Asian, “Middle Eastern”, Muslim, Hindu etc) which is collectively 2.85 with the figures for Jews which is 2.75. So, if we take the data on Jews as reliable, we find - unsurprisingly - that people of colour are more likely victims of hate crime than are Jews. This is the opposite of what we would expect from the headline figures only on religious hate crime, which we cited above. However, it is surely much more in line with all that we know about racism: It is faced largely by black people and people of colour.
Having said this, we can hypothesize that there might be further problems with the data on hate crime to the extent that
- Political lobby groups were able to define the way in which hate crime against the Jews was counted in a manner which was systematically biased and had the result that hate crime against the Jews was artificially inflated by activities that can not legitimately be said to amount to “hate crime”.
- Organizations dealing with the reporting and analysis of hate crime against Jews have close relations with senior police and military officers, and are both funded by, and advisers to, the government;
- There is a well funded campaign to encourage reporting of “hate crime” against the Jews;
- That the CST operationalises an extremely wide and biased conception of “antisemitism”, which deliberately and dishonestly claims that pro-Palestine activism expresses “antisemitism”.
- Political actors such as government ministers, or the Zionist movement, attempted to pressure the police to target pro-Palestine demonstrators with the bogus definition of hate crime against the Jews noted above;
- There is evidence that the police have acceded to pressure from government or Zionists.
If any of these hypotheses were the case, our confidence in these statistics would decline further. As we shall see there is good evidence to suggest that each of these hypothetical suggestions are borne out by empirical evidence. We look at 1-4 in Part 4 and, in Part 5, at the two remaining hypotheses. In which case the data is not as reliable as it might seem, and it might be reasonable to provisionally conclude that the apparent anomaly in relation to hate crime against the Jews may well not be an anomaly at all.
In order to look more closely at this, the next two articles in this series will look at the influence of Zionists on the way in which the data are defined and counted (Part 4) and later on the practical effects of this on the reliability of the data in the period after October 7, 2023 when the operation Al-Aqsa Flood was launched by the Palestinian Resistance (Part 5).

 David Miller
 10 Min Read


